Multiple Time Frame Analysis for Futures Trading
One Chart Lies. Three Charts Tell the Truth.
Learn how multiple time frame analysis for futures trading turns scattered entries into disciplined, drawdown-aware decisions — during your evaluation and after you’re funded.
Table of Contents
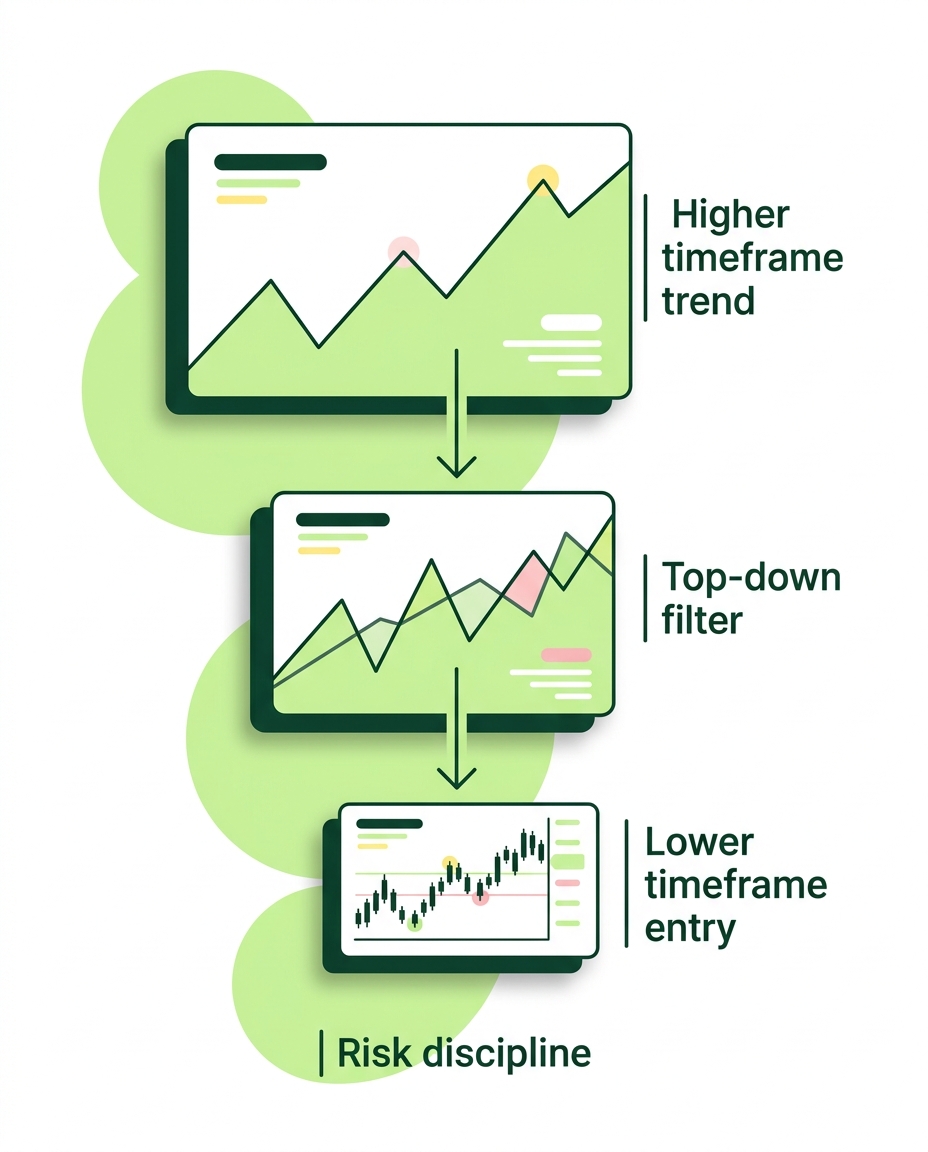
What is multiple time frame analysis in futures trading? Multiple time frame analysis (MTFA) is the practice of reading the same futures contract across two or three chart intervals — typically a higher timeframe like the daily or 4-hour for trend direction, and a lower timeframe like the 15-minute or 5-minute for entry timing. Instead of trading off one chart in isolation, you filter every trade through a top-down analysis trading process: the higher timeframe tells you which direction to lean, and the lower timeframe tells you when to actually click the button. For prop firm traders, this is more than a technical-analysis technique — it is a risk-management filter that keeps you from overtrading into a daily loss limit or trailing drawdown.
Most futures traders discover multiple time frame analysis futures trading strategy concepts the hard way: after a string of impulsive 1-minute entries wipes out a green day. A single chart shows you a slice of price action, but it never tells you whether that slice fits inside a bigger structural move or fights against it. MTFA fixes that blind spot by forcing a sequence — trend context first, trigger second — which is exactly the discipline a broader risk management framework for funded traders is built around.
This matters even more once real capital, or a live evaluation, is on the line. TickWise Funding evaluations run on trailing drawdown and daily loss limits — mechanical rules that don’t care how « right » your read on the market eventually turns out to be. If you scalp against the higher-timeframe trend, you multiply the number of trades that can go wrong, and each wrong trade eats into the exact numbers your evaluation is measuring.
The rest of this guide breaks MTFA into a repeatable process: how to structure your timeframes, how to combine daily and 5-minute charts specifically, which pairings work best for ES, NQ, GC, and CL, and how the discipline you build during a TickWise evaluation should carry directly into unrestricted live trading once you’re funded.
🎯 Start Your TickWise Evaluation →
- Trade using TickWise allocated capital
- Guaranteed payout
- Unlimited withdrawals, anytime
What Is Multiple Time Frame Analysis in Futures Trading?
At its core, multi timeframe analysis strategy work follows a three-layer structure: a macro timeframe for context (weekly or daily), a trading timeframe for structure (4-hour or 1-hour), and an execution timeframe for entries (15-minute or 5-minute). Each layer answers a different question. The macro layer asks « what regime are we in — trending or ranging? » The trading layer asks « where is the current swing likely headed? » The execution layer asks « where, exactly, do I place a stop and a target? »
The mistake most retail futures traders make is collapsing all three questions into one chart. A 5-minute chart alone can’t tell you if you’re buying into resistance from the daily timeframe. A daily chart alone can’t tell you where, tick by tick, your risk should sit. Multiple timeframe analysis futures contracts require this layered read because futures move fast, trade nearly 24 hours across RTH and ETH sessions, and are prone to sharp reversals that punish traders who only look at one window of time.
How to combine daily and 5-minute charts for futures
The most common MTFA day trading pairing is the daily-to-5-minute combination. Start on the daily chart and mark the prevailing trend, recent swing highs/lows, and any key levels — prior day high/low, weekly open, or a visible value area. Drop to the 5-minute chart only after that read is complete, and look exclusively for entries that agree with the daily bias. If the daily trend is up, you’re hunting for pullback entries on the 5-minute, not counter-trend shorts. This single rule — one-directional bias, lower-timeframe trigger — eliminates a large share of the trades that would otherwise be pure noise.
Timeframe confluence trading means waiting for agreement, not forcing it. If the daily is bullish but the 5-minute keeps printing lower highs, that’s not a signal to fight the daily — it’s a signal to wait. Confluence, not conflict, is the entire point of layering timeframes.
Why MTFA Protects a Funded Futures Evaluation
This is the piece almost no article on multiple time frame analysis covers: how it interacts with prop firm rules. A TickWise evaluation is measured against a daily loss limit and a trailing drawdown ceiling — not against how clever your analysis was. Every trade you take that isn’t filtered through a higher-timeframe context is a trade with unknown correlation to your last three losses. Take five uncorrelated 1-minute scalps against a strong daily trend and you can burn through a daily loss limit in twenty minutes, even if each individual trade looked « technically » fine in isolation.
Multi timeframe analysis prop firm evaluation discipline works because it reduces trade frequency and increases trade quality at the same time. When you only take lower-timeframe entries that align with the higher-timeframe trend, you naturally skip the marginal, low-conviction setups that generate the bulk of unnecessary losses. Fewer, better trades means fewer opportunities to trip a daily loss limit, and slower equity erosion means more room before you approach a trailing drawdown ceiling. Understanding how trailing drawdown actually gets calculated makes this concrete: trailing drawdown locks in your peak equity and follows it down, so every avoidable losing trade during an MTFA-filtered session is drawdown cushion you get to keep for the next real opportunity.
💡 Pro Tip: Before every entry during your evaluation, ask one question — « does this trade agree with my higher-timeframe bias? » If the answer is no, skip it. That single filter is worth more to your pass rate than any indicator.
There’s also a premature-exit problem that MTFA solves. Traders who only watch a 1-minute or 5-minute chart often panic-exit winning trades on normal micro-pullbacks, because in isolation those pullbacks look like reversals. Seeing the same pullback on a 15-minute or 1-hour chart, sitting comfortably inside an intact higher-timeframe trend, gives you the context to hold the position — protecting the profit target you need to hit during evaluation, not just the loss limit you need to avoid.
Top-Down Analysis Trading: A Real Example
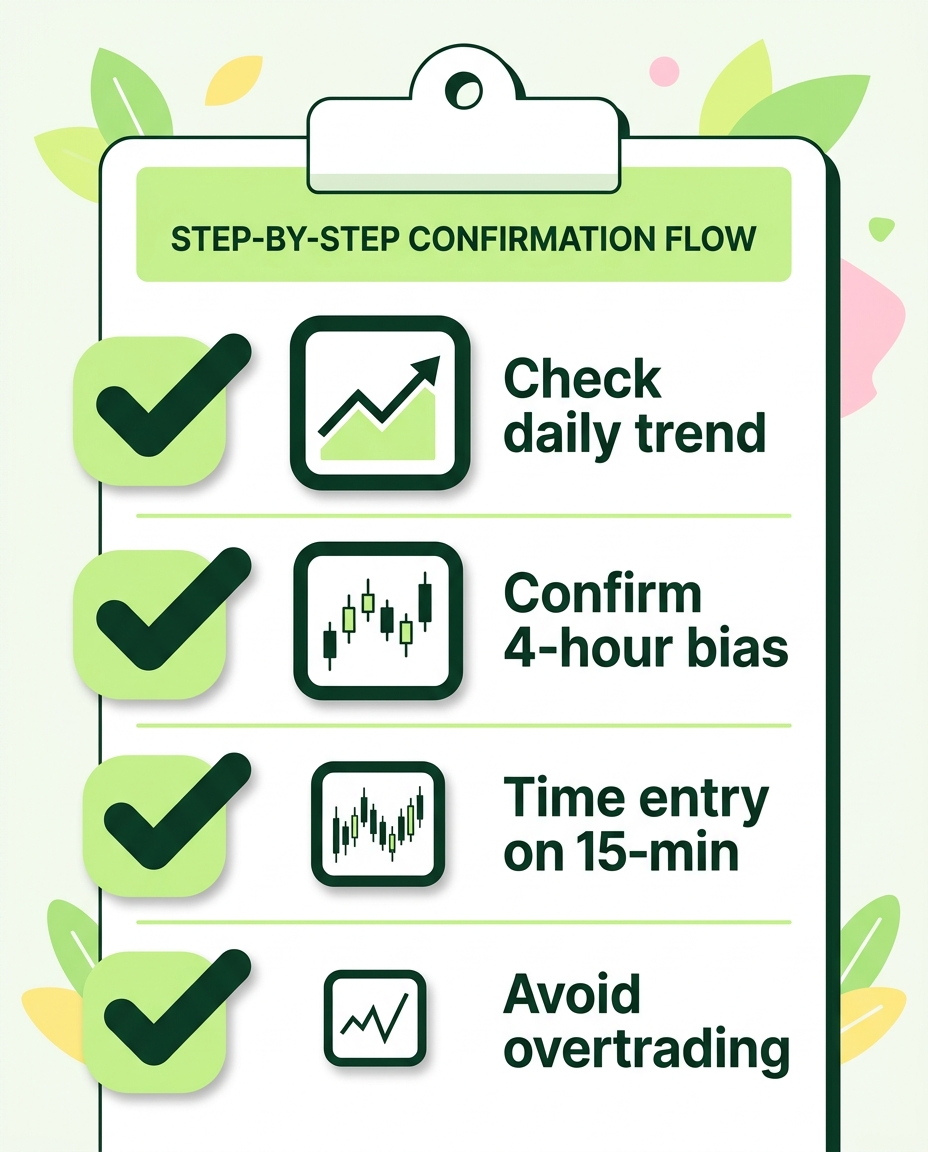
A top down analysis futures trading example makes this concrete. Say ES (E-mini S&P 500) is in a clean uptrend on the daily chart, holding above its 20-day moving average with higher highs and higher lows for the last two weeks. On the 4-hour chart, price just pulled back to a prior breakout level and is consolidating — a classic higher timeframe trend, lower timeframe entry setup. Dropping to the 15-minute chart, you wait for a bullish structure shift: a break of the most recent lower-timeframe swing high, confirming buyers are back in control at that level.
🟢 With MTFA (Top-Down)
- Daily: uptrend confirmed, above 20MA
- 4H: pullback to breakout level
- 15-min: structure shift long entry
- Stop below 4H swing low
- One high-conviction trade per session
Single-Timeframe Only
- 5-min chart only, no context
- Enters on every minor bounce
- No sense of where trend actually is
- Stops placed arbitrarily tight
- Five to ten low-conviction trades
The single-timeframe trader in this comparison isn’t necessarily wrong on any one trade — they’re simply taking far more trades with far less information, which is the exact pattern that erodes a daily loss limit even during an otherwise « normal » trading day. The top-down trader takes one well-defined entry, with a stop tied to real 4-hour structure rather than a random 15-minute swing point.
Best Timeframe Combination for Futures: ES, NQ, GC, CL
Not every contract behaves the same way across sessions, so the best timeframe combination for futures differs slightly by product. Session timing matters here — reviewing session timing across RTH and ETH hours before building your MTFA routine will help you avoid misreading thin overnight structure as a real higher-timeframe signal.
| Contract | Higher Timeframe | Lower Timeframe | Session Note |
|---|---|---|---|
| ES (S&P 500) | Daily / 4H | 15-min / 5-min | RTH (9:30–4:00 ET) carries the real volume; ETH moves can be noise until RTH open. |
| NQ (Nasdaq) | 4H / 1H | 5-min | Faster, wider swings than ES — tighten lower timeframe entries during RTH. |
| GC (Gold) | Daily / 4H | 15-min | ETH volume is meaningful (London/Asia overlap) — don’t discount overnight structure. |
| CL (Crude Oil) | 4H / 1H | 5-min / 15-min | Watch inventory-report windows; higher-timeframe reads can invert fast on news. |
For NQ specifically, pairing a 4-hour trend read with 5-minute execution works well because Nasdaq futures tend to trend harder and pull back faster than ES — see specific NQ setups built for challenges for entry patterns designed around that volatility. For GC, the daily/4H-to-15-minute pairing needs one more layer of caution: gold reacts strongly to macro data releases, and gold futures nuances for funded accounts covers how to size and time entries around that.
Rollover-week caveats no one mentions
Every quarterly futures contract rolls to a new front month, and in the days around rollover, higher-timeframe charts stitched together from continuous contract data can show artificial gaps or distorted moving averages if the roll isn’t volume- or open-interest-adjusted. During rollover week, treat your daily and 4-hour trend reads with extra skepticism — cross-check the front-month chart against the continuous chart, and if they diverge sharply, favor the front-month price action for your lower-timeframe entries since that’s the contract you’re actually trading.
Avoiding Overtrading With Multi-Timeframe Confluence
How to avoid overtrading with multi timeframe analysis prop firm account discipline comes down to one habit: a trade only qualifies if two timeframes agree, and it doesn’t qualify if only one does. This single rule cuts your trade count dramatically, which is precisely the point. Overtrading isn’t really a technical problem — it’s a psychological one, and understanding why traders overtrade under pressure explains why MTFA works as a behavioral guardrail as much as a technical one. When you’re waiting for confluence across two timeframes rather than reacting to every candle on one chart, you physically have fewer decision points where impulse can take over.
Multiple timeframe analysis for day trading futures contracts also gives you a built-in « no-trade » signal. If the higher timeframe is choppy or directionless, MTFA tells you to stand aside — there’s no valid lower-timeframe trigger to look for, because there’s no trend to confirm. Traders without this framework tend to manufacture trades out of a flat, indecisive tape simply because they’re staring at a fast-moving lower-timeframe chart and mistaking noise for opportunity. That manufactured trading is exactly what burns through a daily loss limit on an otherwise unremarkable day.
MTFA Pre-Trade Checklist
- Higher timeframe trend identified and written down before looking at entries
- Lower timeframe entry trigger agrees with that trend direction
- Stop placed against real higher-timeframe structure, not an arbitrary tick count
- No trade taken if higher timeframe is flat or choppy
- Trade count for the session capped once daily loss limit risk is assessed
From Evaluation Habit to Funded Freedom
The habit you build during evaluation is the habit that keeps you funded. TickWise’s STARTER plan ($190, 3 contracts, $25K evaluation) targets a $2,500 evaluation profit with a funded account sized to $2.5K in trading power once you pass. The PRO plan ($290, 6 contracts, $50K evaluation) scales to a $5K funded outcome, and the EXPERT plan ($490, 10 contracts, $100K evaluation) scales to $10K. Same contracts in both phases means the same trading power carries straight through — so the MTFA discipline that got you past evaluation with 6 contracts on a PRO account is the exact discipline you keep applying once funded with those same 6 contracts.
Here’s the part that matters most: once you’re funded, TickWise removes the daily loss limit and profit-target structure — there are no rules once funded beyond staying inside the account’s trailing drawdown. That sounds like freedom, and it is, but it’s also where undisciplined traders who scraped through evaluation on luck tend to unravel. A funded trader who never built the top-down analysis habit has no filter stopping them from overtrading into the one rule that still applies. A funded trader who built MTFA into their process during evaluation simply keeps doing what already worked — fewer trades, higher conviction, trend-aligned entries — except now with more trading power and unlimited withdrawal flexibility instead of a locked evaluation target.
3 → 6 → 10
Contracts: Starter → Pro → Expert, Same Structure Every Step
Whether a $25K, $50K, or $100K evaluation fits your account better depends on how much trading power you want to carry into the funded stage — worth reviewing before you commit, especially by comparing the $50K and $100K account tiers against your own MTFA-filtered trade frequency and risk tolerance.
FAQ: Multiple Time Frame Analysis for Futures Trading
What is multiple time frame analysis in futures trading?
Multiple time frame analysis (MTFA) is reading a futures contract across two or three chart intervals — a higher timeframe like daily or 4-hour for trend direction, and a lower timeframe like 15-minute or 5-minute for entry timing — so every trade agrees with the bigger structural trend before you take it.
What are the best timeframes to trade ES futures?
A daily or 4-hour chart for trend context paired with a 15-minute or 5-minute chart for entries is a common and effective combination for ES, particularly during RTH hours when real volume confirms the moves you’re seeing.
How do I combine daily and 5-minute charts for futures?
Mark the trend, key levels, and swing points on the daily chart first. Only then move to the 5-minute chart, and take entries exclusively in the direction the daily chart supports — treat any 5-minute signal against that daily bias as noise to skip, not a trade to take.
Does multi timeframe analysis really help pass a prop firm evaluation?
Yes — it works by reducing trade frequency and improving trade quality, which directly protects a daily loss limit and slows the erosion of a trailing drawdown ceiling. Fewer, higher-conviction trades mean fewer chances to trip evaluation rules on marginal setups.
Does contract rollover distort higher-timeframe MTFA charts?
It can. Continuous contract charts sometimes show gaps or distorted averages around quarterly rollover. During rollover week, cross-check the front-month chart against the continuous one, and favor the front-month price action since that’s the contract you’re actually trading.
Your Path From MTFA Discipline to Funded Trading
Build the Habit
Practice top-down analysis — higher timeframe trend, lower timeframe entry — on every trade before you ever fund an evaluation.
Choose Your Evaluation
Pick STARTER, PRO, or EXPERT based on the contract count and trading power you want to carry forward.
Trade the Evaluation With Confluence
Let MTFA filter out low-conviction trades, protecting your daily loss limit and trailing drawdown cushion.
Carry the Discipline Into Funded Trading
Same contracts, same MTFA process, now with no rules once funded beyond the account’s drawdown limit.
🚀 Start Your TickWise Evaluation →
⚠️ Risk Disclaimer: Trading futures involves substantial risk of loss and is not suitable for all investors. Past performance is not indicative of future results. Multiple time frame analysis is a technical framework, not a guarantee of profitable outcomes. Only trade with capital you can afford to lose, and review TickWise Funding’s current rules before starting any evaluation.