Market Profile Trading: How Institutional Traders Use TPO Charts
Read The Market Like The Desks That Move It
Market Profile trading with TPO charts shows you where institutional traders are actually building and defending positions — and where a prop firm evaluation gets won or lost.
Table of Contents
A TPO chart (Time Price Opportunity) is a Market Profile tool that plots how much time price spends at each level during a session, built from stacked letters instead of candles. Institutional traders use Market Profile to trade futures by locating the Point of Control (the price with the most time spent, i.e. the fairest value), the Value Area (roughly 70% of the session’s time), and the Initial Balance (the first hour’s range) — then fading extremes or riding confirmed breaks depending on which of these levels price accepts or rejects. Retail traders often skip this because TPO charts look dense and old-fashioned next to a clean candlestick feed. That’s exactly why it matters: this is auction market theory, the same framework CME floor traders and futures desks have used since the 1980s, and it still governs how ES, NQ, GC, and CL move today.
This article treats market profile trading TPO charts as a risk-management tool first, not a signal generator. For a TickWise evaluation trader capped at 3, 6, or 10 contracts and a defined trailing drawdown, the way you read Initial Balance, POC, and Value Area should change behavior — tighter risk while proving consistency during evaluation, and more assertive sizing on confirmed Trend Days once you’re funded and trading under « no rules once funded. »
Before going further into TPO letters and day types, it helps to see how this compares to the more commonly discussed alternative built from the same raw data. If you’ve already read our volume profile analysis for funded accounts guide, Market Profile is the parent concept — Volume Profile weights by contracts traded, Market Profile weights by time. Both converge on similar POC and Value Area levels most sessions, but they diverge exactly when it matters most: on fast, low-volume opens or thin holiday sessions, which is precisely when evaluation traders get caught leaning on a level that isn’t real.
Two mechanical anchors carry the rest of this guide. First, Initial Balance formation is a direct function of how futures session timing shapes Initial Balance — the RTH open on ES/NQ (9:30am ET) sets the first hour’s range that everything else in the profile reacts to. Second, every level you trade against a TPO chart eventually has to survive contact with your account’s drawdown mechanics, which is why we’ll keep circling back to position sizing throughout.
📊 Start Your TickWise Evaluation →
- Trade using TickWise allocated capital
- Guaranteed payout
- Unlimited withdrawals, anytime
What Is A TPO Chart? Market Profile Trading TPO Charts Explained
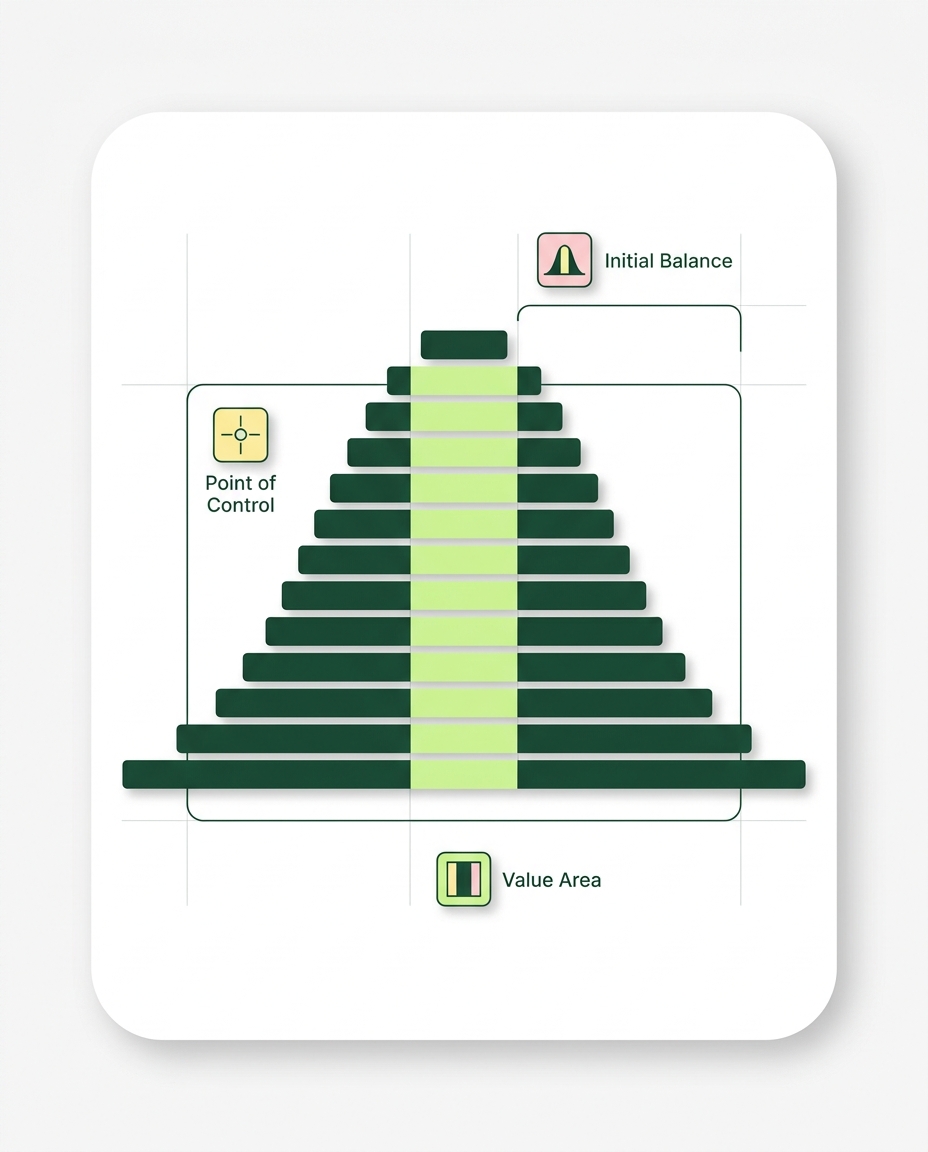
TPO charts explained simply: instead of plotting open-high-low-close for a fixed time interval like a candle, a TPO chart divides the session into 30-minute periods, each assigned a letter (A, B, C…). Every period, the software marks every price level the market touched with that period’s letter. Stack enough periods and the letters pile up sideways into a bell-shaped (or lopsided) distribution — the « profile. » Where the stack is tallest is where the market spent the most time. That’s not an arbitrary statistic; under auction market theory futures traders rely on, time-at-price is a proxy for where two-sided participants — including institutions working large orders — found the auction « fair. »
This is different from a simple horizontal volume histogram, though the two rhyme. A TPO chart values time; a volume profile weights size. On a normal trending session both point to similar zones. On an news-driven spike — a CPI print blowing through GC or a Fed statement whipsawing NQ — volume profile can show a heavy print at a level price barely paused at, while TPO shows the market genuinely accepted a nearby level for extended time. Institutional execution desks watch both because algorithmic slicing (iceberg orders, VWAP execution) shows up more clearly in volume, while genuine two-way acceptance shows up in TPO.
Peter Steidlmayer, a CBOT floor trader, designed Market Profile in the early 1980s specifically so floor traders could visualize auction behavior in real time without a computer. The framework never left — CQG, Sierra Chart, NinjaTrader, and TradingView all still ship native TPO chart modules because institutional order flow trading desks never stopped using it. It survives because it answers one question retail indicators rarely do directly: is the market still auctioning to find value, or has it already found it and is now testing edges?
Reading Point Of Control, Value Area & Initial Balance
Three reference points do almost all the work in market profile trading.
Point of Control (POC)
The POC is the single price level where the most TPOs stacked — the tallest column in the profile, and the anchor for any point of control trading strategy. Price gravitates back toward POC repeatedly within a session because it represents the level both buyers and sellers have already agreed is fair. A POC that holds across multiple sessions (a « stacked POC ») becomes a magnet traders watch for weeks. On ES, a POC sitting at a prior week’s high often becomes the first target on any pullback.
Value Area High and Low (VAH/VAL)
Value area high low trading is built around the boundary of the middle 70% of the day’s TPO distribution. Everything inside VAH-VAL is « accepted » value; everything outside is considered an extreme the market is still testing. A push through VAH on strong participation with acceptance (not just a wick) suggests the auction is migrating higher — a genuine directional signal. A push through VAH that immediately snaps back inside is a classic fade setup, because it confirms the level outside was rejected, not accepted.
Initial Balance (IB)
What is initial balance in market profile trading? It’s the range established in the first one to two 30-minute TPO periods of the session — effectively the first hour on index futures. IB range tells you how « decided » the market is early: a narrow IB (tight first hour) often precedes a bigger range-expansion move later in the day, while a wide IB more often precedes a range-bound, rotational session. Traders watch whether price holds inside IB, breaks it and holds (range extension = trend building), or breaks it and fails (a trap, often called a « poor high » or « poor low » when the extreme wasn’t well-tested by multiple TPO letters).
POC
Fairest Traded Price
VAH/VAL
70% Value Boundaries
IB
First-Hour Range
TPO
Letters Per 30-min
How to read TPO letters on a futures chart in practice: scan left to right for where the letter columns extend widest (POC/value area), then look at the single-print tails at the top and bottom — thin columns with only one or two letters — which mark where price moved through quickly without acceptance. Those single prints are often the first level to get revisited and retested, because thin acceptance means the auction left unfinished business.
Market Profile Day Types And Session Timing
Market profile day types classify how the session’s shape evolved, and this classification is exactly where session timing matters. A trend day vs normal day market profile futures distinction changes how you should be positioned within minutes of the open.
🟢 Normal / Neutral Day
- IB holds through most of the session
- Balanced, bell-shaped profile
- Price rotates between VAH and VAL
- Fade extremes, target POC
- Common on quiet NQ/ES mid-week sessions
Trend Day
- IB breaks early and never comes back
- Elongated, one-directional profile
- Range extension both above and below IB
- Trade with the break, avoid fading
- Common on CPI/NFP/FOMC sessions
The other common types worth knowing: a « double distribution day » shows two separate value areas stacked with a gap between them (common after a news-driven repricing), and a « non-trend day » barely extends beyond IB at all, telling you liquidity is thin and ranges will stay small — a day best sized down, not up.
Day-type classification only means something once you tie it to the clock. Initial Balance on ES and NQ is set in the first hour of the 9:30am ET regular session; on GC and CL, the relevant IB often forms around the CME open or a major macro release inside the session. A narrow IB on the ES open followed by a clean break above VAH within the first 90 minutes on a CPI morning is a strong early trend-day signal — precisely the setup order flow traders watch for.
Trading POC And Value Area Retests
How to trade point of control (POC) retest in futures comes down to a simple sequence: wait for price to move away from POC, confirm it’s holding new value away from that level (multiple TPO periods printing there, not a single wick), then look for a controlled pullback that retests POC without breaking through it on a closing basis. The retest entry sits just beyond POC with a stop placed past the nearest Poor High or Poor Low — the thin single-print zone that marks where the last failed auction attempt happened, which is a tighter, more defensible stop than an arbitrary tick count.
Concrete example on NQ: say the prior session’s POC sits at 19,850 with VAH at 19,910 and VAL at 19,790. Price opens above VAH, holds for two hours confirming acceptance above the old value area, then pulls back toward 19,880 without trading below 19,850. That’s a POC-adjacent long, stop below the Poor Low at roughly 19,830 (a 20-point / $400-per-contract risk on NQ’s $20-per-point value), targeting a return to the new developing VAH. On GC, the same logic at $100-per-tick value means a $2 stop below a defended low is a $200-per-contract risk — small enough to run 2-3 contracts inside a Starter evaluation’s $500 daily loss limit with room to spare.
This is where pairing order flow signals with your reads earns its keep — a POC retest that also shows absorption on the tape (large resting bids defending the level) is a materially higher-conviction entry than the TPO structure alone. Market Profile tells you where the fight is happening; order flow tells you who’s winning it in real time.
Fake breakouts are the other half of this trade. A push beyond Initial Balance that fails to hold — price re-enters IB within the same or next TPO period — is one of the most reliable failure signals in Market Profile trading, and it’s a mirror image of spotting genuine breakouts beyond the range: genuine range breaks hold and build range extension; fake ones snap back and punish anyone who chased.
Market Profile Trading Strategy For Prop Firm Evaluation vs Funded Accounts
How do institutional traders use market profile to trade futures under real constraints? Desks manage size against risk limits every single day — which is precisely the discipline a market profile trading strategy for prop firm evaluation should mirror, just scaled to a retail-sized account.
Evaluation Phase: Tight Risk, Respect Initial Balance
During a TickWise evaluation — Starter at 3 contracts / $25K, Pro at 6 contracts / $50K, Expert at 10 contracts / $100K — the priority is proving consistency inside your trailing drawdown, not maximizing every setup. That means treating a break beyond Initial Balance with suspicion until it’s confirmed: wait for a full TPO period to close beyond the IB extreme before sizing in, rather than jumping on the first tick through the level. A Starter trader running ES might take only 1 of 3 available contracts on an unconfirmed IB break, reserving size for a retest that holds. This is exactly where fake breakouts beyond Initial Balance do the most damage to an evaluation — one 15-point ES stop-out on a failed IB break can eat a third of a Starter’s $500 daily loss limit for no real edge.
Funded Phase: Size Up On Confirmed Trend Days
Once funded, TickWise’s same contracts in both phases means your trading power doesn’t change — a Pro trader still runs 6 contracts, just on a live $5K funded account instead of the $50K evaluation. What changes is conviction and rule structure: « no rules once funded » means there’s no daily loss limit or profit target holding you back on a session that’s clearly classified as a Trend Day. If NQ breaks its IB on a FOMC morning, holds range extension through the first two hours, and prints an elongated one-directional profile with no meaningful retracement into value — that’s the highest-conviction setup Market Profile produces, and a funded trader can run full size into it without the evaluation-phase hesitation, because there’s no daily cap forcing an early exit.
💡 Practical framing: Evaluation phase = fade extremes, respect IB, small size on unconfirmed breaks. Funded phase = same contract count, but full conviction on confirmed Trend Days once the profile structure is unambiguous.
None of this replaces understanding your trailing drawdown mechanics first — TPO reads tell you where to engage, but your account’s drawdown type tells you how much room you actually have to be wrong before a retest thesis needs to be abandoned.
Building A Market Profile Routine
A repeatable Market Profile routine has three steps done before the session opens, and one done live.
Pre-Session Market Profile Checklist
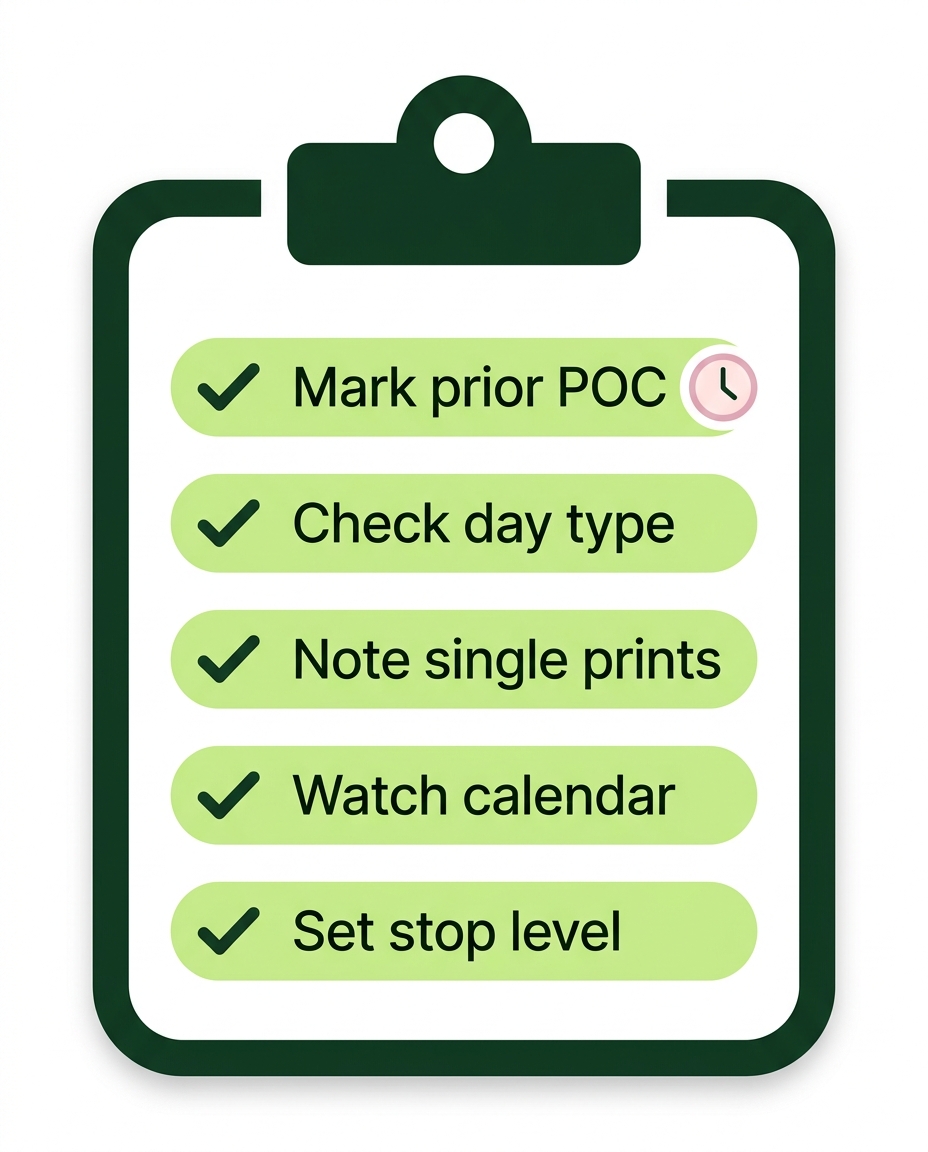
- Mark yesterday’s POC, VAH, and VAL on today’s chart
- Note whether yesterday was a trend, normal, or non-trend day
- Identify any single-print zones (Poor Highs/Lows) left unresolved
- Check the economic calendar for session-timing catalysts (CPI, NFP, FOMC)
- Set a hard stop level tied to the nearest Poor High/Low before entering
Live, the only real-time job is watching how the first hour behaves against yesterday’s levels: does IB form inside yesterday’s value area (balance likely continues), or does it open and immediately push through VAH/VAL with acceptance (trend building)? That single read, done consistently, is what separates traders who treat TPO charts as background noise from those who use them the way institutional desks always have — as a live map of where the auction is fair and where it’s still being contested.
🚨 Common mistake: Trading every touch of POC as a mechanical bounce. POC retests only work as a strategy when the level has genuine multi-period acceptance behind it — a POC formed on one thin, fast print is not the same signal as one built over three hours of rotation.
Frequently Asked Questions
TPO chart vs volume profile for futures trading — which is better?
Neither replaces the other; they measure different things. TPO weights time spent at each price, revealing genuine two-sided acceptance. Volume profile weights contracts traded, revealing where size actually transacted. On calm sessions they largely agree. On thin or news-driven sessions they can diverge — TPO showing acceptance where volume was actually light, or volume showing a heavy print where price barely paused. Many futures traders layer both rather than picking one.
How do institutional traders use Market Profile to trade futures day to day?
Institutional and floor-trading desks use Market Profile primarily to gauge whether the current auction is still searching for value (balanced, rotational) or has already found direction (trending, extending). That read shapes whether a desk works passive orders near value or aggressively chases a breakout — the same decision a retail futures trader makes at a smaller size. For a next step applying this to a specific contract, see applying these reads to NQ setups.
What is a market profile indicator for futures and where do I get one?
Most charting platforms with futures data (Sierra Chart, NinjaTrader, TradingView with an add-on, CQG) ship a native TPO/Market Profile study that auto-plots letters, POC, VAH, and VAL per session. You don’t need to build the profile manually — the work is in interpreting the shape once it’s plotted, not generating it.
Is Market Profile trading suitable for a prop firm evaluation with limited contracts?
Yes, and arguably it’s better suited to evaluation trading than to unlimited retail accounts precisely because it emphasizes waiting for confirmation (full TPO period closes, not just wicks) before committing size — a discipline that naturally fits a capped contract count and a defined daily loss limit.
How many TPO periods should I wait for before trusting a breakout beyond Initial Balance?
There’s no universal number, but many futures traders wait for at least one full 30-minute period to close beyond the IB extreme, plus a failed retest back into IB, before treating the break as genuine range extension rather than a single stop-running spike.
A Simple Path to Funded Trading
Choose Evaluation
Select Starter (3 contracts / $25K), Pro (6 contracts / $50K), or Expert (10 contracts / $100K) to match your Market Profile trading size.
Trade Safely
Respect Initial Balance, wait for confirmed acceptance beyond value, and keep stops tied to defensible Poor Highs/Lows within your trailing drawdown.
Get Funded
Move to a funded account with the same contract count and real allocated capital — no re-sizing required.
Trade With No Rules
Once funded, size up conviction on confirmed Trend Days and withdraw profits freely — no daily loss limit, no profit target.
Market Profile and TPO charts won’t turn a random entry into an edge on their own — but paired with disciplined sizing, they give you the same map institutional desks have used for four decades to know where value is being built and where it’s being tested. Combine that map with building a risk framework once you’re funded and you have a genuinely repeatable approach, from your first evaluation session through funded trading.
🚀 Start Your TickWise Evaluation →
⚠️ Risk Disclaimer: Trading futures involves substantial risk of loss and is not suitable for all investors. Past performance is not indicative of future results. Market Profile and TPO analysis are analytical frameworks, not guarantees of any trading outcome. Only trade with capital you can afford to lose. This article is for educational purposes and is based on publicly available information as of July 2026.